Wednesday, December 30, 2009
Become A Better Investor Through Specialization
What can you do to immediately become a better investor/trader? There are several things you can do to immediately speed up your investment learning curve. One of those is specialization. Investment/Trading specialization is one of the most important stages that aspiring investors/trader can reach in their development. In fact, the sooner you are able to reach this place, the better off you will be and the higher your returns will be.
When you step out into the investment and trading world, you are instantly pitting yourself against an extraordinary array of competitors and professionals. There are literally millions of others out there who want the same profits you want, and the laws of the marketplace simply object to everybody walking away with bags filled with riches. In fact, most will walk away with significantly less capital than they started with.
Given this intense competition, market inefficiency, and the limited space inside the investment winners' circle, do you really want to go out there and compete half-heartedly in a whole host of events, likely losing at nearly all of them? In investing it is a much better idea to become an absolute, top-of-the-line expert in one area, and then go out and win the field in that specialty.
As far as specialties go, there are very many options you have. Here are some choices you have to distinguish your investment specialization:
Time Frame: This is one of the first and most basic distinctions that you can make as an investor/trader. While the thought of mastering every single time frame is appealing, and it may in fact be your long-term goal, you do not have to do it all at once. Choosing a time frame to specialize in allows your trading to be customized for you and your schedule. It also gives you direction as to what strategies you should be more focused on.
Patterns/Strategy: You can further specialize yourself by limiting the number of patterns you choose to utilize. By limiting the patterns, indicators, or other factors that comprise your strategy this allows you to solidify your investment plan and follow it rigorously. If you specialize your strategy this mean you specialize the criteria or rules that tell you to get in and get out of the market. You will then become a more disciplined and focused investor, which is always a good thing.
Markets/Sectors: There are many investors/traders out there who specialize in a particular sector, or sometimes a few select industry groups that they understand very well. Also, there are just as many who specialize in just one specific market, such as currencies, emerging markets, bonds, etc..Perhaps you have a professional background you can bring to bear regarding your sector analysis. Narrowing the field in this manner is yet another way to become an expert investor/trader. I have met a trader who trades only Pork Bellies, pays zero attention to any of the other markets (DOW, S&P, Gold, etc..) and achieves very high returns (sometimes triple digits) because of this specialization.
Market Stages: Some of us choose to hone in on one of four market stages as our chosen trading environment. For purposes of making these distinctions, there are really three categories: Uptrend, downtrend, and consolidations. I have met several traders who actually do best in and therefore trade only in a range environment. Others love it best when the market is tanking, and invest/trade on the short side. The majority, however, will probably gravitate to uptrends for their time frame of choice. You can also develop a system to glide between the various market stages, investing in up, down, or sideways markets.
There are certainly other specializations you can have as an investor/trader, but these above are the basics and where you should start to hone your skills. I find it is easier to start with choosing the time frame and market then move on to the other specialty areas. It is fine to mix and match between them, as long as your final criteria exhibit enough restrictions to qualify as a true specialty. If you do choose to have several specializations just make sure each specialization has a system with rules that adhere to those criteria. For example you can utilize both a short-term crude oil contrarion trading system, while also using a long-term technology shorting system; however, you would not want to mix the two systems rules together, keep them both specialized and separated from one another.
Tuesday, December 29, 2009
Technical Analysis Of the Metals Market
Gold has closed lower today due to break of support levels, and remains below the 10-day moving average crossing near 1110.00. Stochastics and the RSI are oversold and are both still suggesting for more losses.Closes above the 20-day moving average crossing at 1137.40 are needed to confirm that a short-term low has been posted. If a further decline ensues from here the 38% retracement level of this year's rally crossing at 1032.60 is the next downside target. First resistance is the 10-day moving average crossing at 1109.00. Second resistance is the 20-day moving average crossing at 1137.40. First support is last Tuesday's low crossing at 1075.20. Second support is the 38% retracement level of this year's rally crossing at 1032.60.

Silver closed lower due to long covering and breaks of short term support levels; also, silver extended this month's trading range. The mid-range close sets the stage for a steady opening Wednesday. Stochastics and the RSI are both moderately oversold, diverging, and are turning bullish hinting that a short-term low might be in, or is near. Closes above the 20-day moving average crossing at 17.779 are needed to confirm that a short-term low has been posted. The reaction low crossing at 16.155 is the next downside target. First resistance is the 20-day moving average crossing at 17.779. Second resistance is this month's high crossing at 19.500. First support is last Tuesday's low crossing at 16.780. Second support is the reaction low crossing at 16.155.
Copper has managed to close higher today as it continues its short term rally. Also, Copper has posted a new high for the year. The high-range close sets the stage for a steady to higher opening on Wednesday. Stochastics and the RSI are still bullish signaling that sideways to higher prices are possible near-term. The 87% retracement level of the 2008-decline crossing at 3.48 is the next upside target. Closes below the 20-day moving average crossing at 3.18 are needed to confirm that a short-term top has been posted. First resistance is yesterday's high crossing at 3.344. Second resistance is the 87% retracement level of the 2008-decline crossing at 3.48. First support is the 20-day moving average crossing at 3.18; second support is the reaction low crossing at 3.08.
We are currently bearish on both Gold and Silver in the medium to short-term, suggesting that you still have time to purchase these two hard commodities at lower prices in the near future. However, we are neutral at the moment on Copper, and waiting for it to close above 3.34 which at that point we will turn bullish, or close below 3.18 would turn us bearish on copper for the short term.
Monday, December 28, 2009
How To Enroll Into A Debt Management Program
If you’re having a tough time to make the monthly minimum payments on your credit cards and other forms of unsecured debt, then a debt management program (DMP) might be the answer to all your problems. A debt management program can make you debt free and help you get back the control over your finances. Most of the people become overextended with debt as a result of delayed payments that lead to late fees and increased interest rates. People often spend frivolously with their credit cards and max out on their cards, which subsequently result in over the limit fees.
With extra fees and raised interest rates, your payments go out of your control and you find it harder to pay off your debts. In this kind of circumstances, you can use a debt management program to come out of the debt trap.
Collect your statements for credit cards and all other unsecured debts. Also get your paycheck stubs and records of other income. Lastly, prepare a list of your monthly expenditures, for example utility bills, housing expenses, conveyance bills and other monthly expenses. You would require these items for the purpose of formulating a debt management plan.
Find a trustworthy consumer credit counseling agency in your neighborhood. Make an appointment with them and you must not forget to carry the records you have collected. The consumer credit counseling agency would help you make a practical evaluation of your finances and would communicate with your creditors on your behalf to bargain reduced interest rates, relinquishment of fees and possibly extension of your repayment term to pay down your debts. In doing this, they would assess your repayment capacity. As soon as your creditors have accepted the debt management plan, the consumer credit counseling agency would process your payments. Some agencies charge a nominal monthly fee, which is optional most of the time.
You just need to make one monthly payment regularly to your consumer credit counseling agency. Subsequently, the agency would allocate the payment among your creditors in line with the debt management program.
Wednesday, December 23, 2009
Low Volume Of the Holiday Week, As Usual, Is Not Likely To Provide The Needed Breakout
Despite some downward, selling pressures, the major indices main support and resistance have once again held. Currently, the overall bullish trend of the market persists; however, there is a range pattern forming and the upward momentum has diminished significantly in the last month Some of the technical indicators have weakened, but as long as support holds, they are not very important.
On the up side, the S&P 500 resistance in the 1155 - 1160 area remains in tact, resulting in a tight trading range. For four straight days [recently], the S&P 500 ($SPX) opened above 1110 and traded higher, but each day selling pushed the closing back below 1110, it has just recently managed to close above 1110 but the low volume suggests a false breakout. First support for the S&P 500 is now at 1110. Resistance for the DOW Jones Industrial Average remains at 10,550 and there is first support at 10,437 and then the next major support level at 10,280/290. It would take a daily close outside of these levels to have meaningful significance. Also, both of these indices are forming a bearish (inclining wedge) pattern.
Market tops are usually marked by weakening breadth. Numerous breadth oscillators have shown much weakness over the last month. That weakening breadth, combined with a bearish pattern and not being able to break above resistance are certainly all negative signs.
Equity-only put-call ratios have been unreliable ever since heavy hedging activity began last summer. That activity seems to be abating now, so we are tentatively looking to use the equity-only ratios as reliable market indicators again. These ratios have also recently generated bearish signals.
Volatility indices ($VIX and $VXO) continue to decline, and that is generally bullish for stocks. $VIX would have to close above 25 to potentially change its chart to bearish. However, these volatility measures are at historically low, or below average levels, suggesting it may be time for them to spike up with an increase in volatility, which would then lead to an increase in risk aversion and a market decline.
Meanwhile, the $VIX futures continue to trade with large premiums. The January premium is 3.70 and February is a relatively large 5.50. These large premiums indicate an overbought market, but Sell signals wouldn’t be generated until the premium peaks and falls below 1.00 or so. Also, other indicators of market strength such as RSI, Stochastics, MACD, etc.. all indicate the market is overbought, and they are starting to turn negative which would produce sell signals as well.
The term structure of the $VIX futures continues to slope steeply upwards, which is another indication of a bullish but overbought condition. This has persisted to some extent since March. A term structure intermediate-term Sell signal would occur only if the structure began to slope downwards.
In summary, both bulls and bears are in a stuck, confused position at the moment. It will remain this way until a breakout of the above mentioned support or resistances occurs. Once the breakout occurs it will be a very large, capitulation move for the markets. Due to our analysis, this breakout we believe is most likely to be to the downside for the markets. We suggest you either allocate your investments for a rise in volatility, or since we are generally bearish at the moment, begin decreasing your exposure to equities. If you have a shorter time frame in mind you could buy or sell the major markets on a breakout of the two above levels, or trade the range between the two levels, this however can be complex so we suggest you do your due diligence before trading short-term. Just call us at 262-939-8885 and we can help you with any questions you may have about how to be prepared. Have a very Merry Christmas, and we will post more "Seedlings For Your Healthiest Money Tree" at the beginning of next week.
Friday, December 18, 2009
Technical Outlook For Gold - Daily
Gold's fall from 1227.5 has resumed and the precious metal has broke 1110.2 and reached as low as 1097.7. Intraday technical analysis suggests more downside, with the next target near the 50% retracement of 931.3 to 1227.5 at 1079.40 . On the upside, there is 1142.9 resistance, and if this is broken then a short term bottom may be formed and bring stronger recovery towards testing the highs.
In the bigger picture, rise from 681 has good possibility of developing into a of five wave sequence (popular pattern for technical analysis , Elliot Wave) with first wave completed at 1007.7, second wave triangle consolidation completed at 931.3. Rise from 931.3 is treated as the third wave and has possibly completed at 1227.5 after missing 100% projection of 681 to 1007.7 from 931.3 at 1258.
A deeper pull back from the current levels will test the 1026.9 - 1072 support zone (should provide a good medium-term buying opportunity for a bounce off support and resumption of the uptrend for fifth wave completion), or even further to retest 1000 psychological level. But downside should be contained above 931.3 support and bring up trend resumption. If this is indeed an elliot wave pattern for gold then gold prices shall not fall below the 1,010 support mentioned above (end of first wave) before reaching a new high for the fifth wave, which is currently projected to reach the 1,250 - 1,300 level. Daily indicators have yet to show significant enough divergence to suggest a trend change, and there is multitudes of support coming in slightly below Golds current levels, with these two factors in mind Gold may soon provide a nice buying opportunity for investors of all time frames.
Comex Gold - 4 Hours Chart

Comex Gold - Daily Chart

In the bigger picture, rise from 681 has good possibility of developing into a of five wave sequence (popular pattern for technical analysis , Elliot Wave) with first wave completed at 1007.7, second wave triangle consolidation completed at 931.3. Rise from 931.3 is treated as the third wave and has possibly completed at 1227.5 after missing 100% projection of 681 to 1007.7 from 931.3 at 1258.
A deeper pull back from the current levels will test the 1026.9 - 1072 support zone (should provide a good medium-term buying opportunity for a bounce off support and resumption of the uptrend for fifth wave completion), or even further to retest 1000 psychological level. But downside should be contained above 931.3 support and bring up trend resumption. If this is indeed an elliot wave pattern for gold then gold prices shall not fall below the 1,010 support mentioned above (end of first wave) before reaching a new high for the fifth wave, which is currently projected to reach the 1,250 - 1,300 level. Daily indicators have yet to show significant enough divergence to suggest a trend change, and there is multitudes of support coming in slightly below Golds current levels, with these two factors in mind Gold may soon provide a nice buying opportunity for investors of all time frames.
Comex Gold - 4 Hours Chart


Thursday, December 17, 2009
Pivotal Period For The Dollar
The movements of the US dollar index and the dollar against most major currencies over the past few days has caught the market’s attention. For the first time since early March when technical analysis of the dollar index indicated a top, daily technical analysis has now turned moderately in favor of the dollar, suggesting at least a short-term low has been made and short term dollar strength to come.
How significant is this low the dollar recently hit?

The dollar index marked a high in early March at 89.71 and hit a low nearly two weeks ago of 74.27. On these lows, the selling (for a change) was not as heavy as before with the on-balance volume (OBV) acting much stronger and forming a bullish divergence, line e. The initial OBV resistance, line d, was overcome and further new highs would be quite positive. A move in the OBV above the longer-term resistance at line c would be even more impressive. The daily downtrend at 76.70 should be tested this week, and a test of the 23.6% resistance at 78 is likely over the next week or so. Normally, I would expect the rally to stall in this area, but with the massive short dollar position, this may not happen. The first major upside target is the 38.2% resistance at the 80 level.

The weekly chart of the EUR/USD shows that the euro peaked at near 1.5142 nearly three weeks ago, falling short of the major 78.6% resistance level in the 1.5225 - 5275 area. The euro (through December 8) is testing the weekly uptrend, line a, and chart support in the 1.4630 area. There is additional support in the 1.4500 area. The weekly RSI formed a short-term negative divergence at the recent highs, point 2, and is likely to break its uptrend, line b, this week. At a major top, we would normally expect to see a divergence that was formed over a longer time period, but if one assumes that this whole rally was just a rebound of the 2008 decline, then it could end with such a short-term divergence. Typically, we would expect to see another one to three weeks on the downside and then a rally that would take the RSI back to its declining WMA. This could be an optimum dollar selling opportunity.

The daily analysis of the euro futures nicely supports the weekly analysis as the euro futures made marginal new highs last week, point 2, but the OBV was much weaker. This indicates that there were significantly fewer buyers than there were on the prior highs (point 1). The break of the uptrend in the OBV, line c, confirms the negative divergence as well as the break of the uptrend in prices, line b. I would not be surprised to see a strong rebound in the euro if support in the 1.4300-4350 area is tested (EUR/USD is currently rebounding strongly from just hitting 1.4305 a few hours ago). First resistance is now in the 1.4650-1.4750 area.
The next few months may be a paradigm shift for the dollar sentiment. With technical and fundamental factors conflicting, the real catalyst should be when the Fed becomes more hawkish (decrease money supply, raising rates), or when the major market indices break significant support levels. While nearly everyone is looking for the Fed to raise rates before the dollar can mark a new multi-year bottom, the technical outlook suggests that with the current position of the federal reserve policy the dollar has a good chance of hitting that new multi-year low below 70.5 on the dollar index before rates are raised in mid-2010.
How significant is this low the dollar recently hit?

Figure 1
The dollar index marked a high in early March at 89.71 and hit a low nearly two weeks ago of 74.27. On these lows, the selling (for a change) was not as heavy as before with the on-balance volume (OBV) acting much stronger and forming a bullish divergence, line e. The initial OBV resistance, line d, was overcome and further new highs would be quite positive. A move in the OBV above the longer-term resistance at line c would be even more impressive. The daily downtrend at 76.70 should be tested this week, and a test of the 23.6% resistance at 78 is likely over the next week or so. Normally, I would expect the rally to stall in this area, but with the massive short dollar position, this may not happen. The first major upside target is the 38.2% resistance at the 80 level.

Figure 2

Figure 3
The daily analysis of the euro futures nicely supports the weekly analysis as the euro futures made marginal new highs last week, point 2, but the OBV was much weaker. This indicates that there were significantly fewer buyers than there were on the prior highs (point 1). The break of the uptrend in the OBV, line c, confirms the negative divergence as well as the break of the uptrend in prices, line b. I would not be surprised to see a strong rebound in the euro if support in the 1.4300-4350 area is tested (EUR/USD is currently rebounding strongly from just hitting 1.4305 a few hours ago). First resistance is now in the 1.4650-1.4750 area.
The next few months may be a paradigm shift for the dollar sentiment. With technical and fundamental factors conflicting, the real catalyst should be when the Fed becomes more hawkish (decrease money supply, raising rates), or when the major market indices break significant support levels. While nearly everyone is looking for the Fed to raise rates before the dollar can mark a new multi-year bottom, the technical outlook suggests that with the current position of the federal reserve policy the dollar has a good chance of hitting that new multi-year low below 70.5 on the dollar index before rates are raised in mid-2010.
Wednesday, December 16, 2009
Are The Grain Markets Looking A Little Grainy?
Yesterday, March corn futures closed down 2 cents at $4.065, and this closing price was very near the session low. Losses were limited by a fresh export sale of U.S. corn yesterday. However, bulls appear to be getting tired after the recent rally. Prices are trapped in the middle of a choppy trading range at higher price levels, bound by solid support at the November low of $3.72 1/2 and by solid resistance at the November high of $4.25. Bulls still have the overall short-term technical advantage. The next upside price objective is to push and close prices above strong technical resistance at the November high of $4.25 a bushel. The next downside price objective for the bears is to push and close prices below solid technical support at $3.90 a bushel. First resistance for March corn is seen at this week's high of $4.10 and then at $4.15. First support is seen at yesterday's low of $4.05 and then at $4.00.
January soybeans closed down 1/4 cent at $10.54 3/4 a bushel yesterday, and prices closed near the session low. Prices could not manage to gain upward momentum despite a fresh announcement of a large sale of U.S. soybeans to China. This suggests the bulls have become exhausted as prices reach the upper boundary of the recent trading range. Bulls do still have the overall near-term technical advantage. The next upside technical objective for the bulls is pushing and closing January prices above solid technical resistance at the December high of $10.78 1/2 a bushel. The next downside price objective for the bears is pushing and closing prices below solid technical support at the December low of $10.19 a bushel. First resistance for January soybeans is seen at yesterday's high of $10.68 1/2 and then at $10.78 1/2. First support is seen at yesterday's low of $10.49 1/2 and then at $10.40.

March soybean meal closed steady at $312.60 yesterday. Prices closed near mid-range yesterday and also hit a fresh four-month high. Bulls have the overall near-term technical advantage. Prices are in a nine-week-old uptrend on the daily chart. The next upside price objective is a close above solid technical resistance at $325.00. The next downside price objective for the bears is below solid technical support at last week's low of $298.90. First short term resistance comes in at $314.80 and then at yesterday's high of $316.60. First support is seen at yesterday's low of $310.10 and then at $307.50.
March bean oil closed up 1 point at 40.05 cents yesterday. Prices closed near mid-range. Bean oil bulls still have the overall near-term technical advantage, but are fading a bit. The next upside price objective for the bean oil bulls is pushing and closing prices above solid technical resistance at last week's high of 41.44 cents. Bean oil bears' next downside technical price objective is pushing and closing prices below solid technical support at 39.00 cents. First resistance is seen at yesterday's high of 40.40 cents and then at 40.75 cents. First support is seen at yesterday's low of 39.81 cents and then at this week's low of 39.61 cents.
March Chicago SRW wheat closed down 6 3/4 cents at $5.36 3/4 yesterday. Prices closed near the session low. Bears still have the overall near-term technical advantage. The next downside price objective for the bears is pushing and closing prices below solid technical support at the November low of $5.07 1/2. Bulls' next upside price objective is to push and close March futures prices above solid technical resistance at $5.70 a bushel. First resistance is seen at this week's high of $5.48 and then at $5.52. First support lies at last week's low of $5.30 and then at $5.25.
March K.C. HRW wheat closed down 7 1/2 cents at $5.26 1/2 yesterday. Prices closed near the session low. Bears still have the overall near-term technical advantage. Bulls' next upside price objective is pushing prices above solid technical resistance at $5.60. The bears' next downside objective is pushing and closing prices below solid technical support at the November low of $5.16. First resistance is seen at yesterday's high of $5.31 1/2 and then at this week's high of $5.39. First support is seen at yesterday's low of $5.26 and then at last week's low of $5.22 1/2.
March oats closed up 1 1/4 cent at $2.60 yesterday. Prices closed near the session high. Bears still have the overall near-term technical advantage. Bulls' next upside price objective is pushing and closing prices above solid technical resistance at $2.65. Bears' next downside price objective is pushing and closing prices below solid technical support at $2.50. First resistance lies at this week's high of $2.62 and then at $2.65. First support is seen at $2.57 1/2 and then at yesterday's low of $2.56 1/2.
Monday, December 14, 2009
Investing With The Big Picture
Multiple Timeframe Confirmation, or MTC is nothing new, however it is a method of investing that is gaining more attention with traders and investors of all types. MTC is the art of finding investment opportunities characterized by bullish (or bearish) chart dynamics in timeframes other than the primary one the investor/trader is using. For example, if I am trading in the hourly chart I might look at the daily and 5-minute chart to see what the market looks like in both the longer and intraday timeframes.
Summary
Multiple Timeframe Confirmation is a powerful tool for confirming direction and trend before entering any trade/investment. Regardless of the platform you use, applying the principle of MTC can dramatically improve your results. If you display charts in several timeframes at the same time and confirm across them, you will definitely gain an edge in your trading.
Using MTC, we identify a trading signal in the dominant timeframe we are investing/trading, and then confirm it across the other timeframes. For example, if you are an end of day trader using Daily Charts. You might be running a simple MACD indicator system to look for reversals. When you see a trading signal, you should look at the weekly chart to see if there is a bullish pattern in that timeframe. Assuming there is, you would then look at the 60 minute chart to see what happened in the last 4-5 hours of trading. If there is bullish sentiment in that timeframe as well, you would then enter the trade.
When examining a LONGER timeframe, we are looking for longer term support and resistance and (optionally) bullish indicators in that timeframe. The idea here is to determine whether we are near a significant level in the longer term chart that might affect our trade, since the psychology of the market could easily be affected by, say, a support level going back as far as even a few years. If Stock ABC has hit $20 four times in the last year and rallied, you probably don’t want to be shorting it at $20.50. Similarly, if the stock is breaking through $30 in the daily chart but the weekly or monthly shows all-time resistance at $31, you probably want to wait until $31 has been surpassed before buying it.
When we examine a SHORTER timeframe, we are looking for shorter term chart patterns – especially Consolidations, Saucers, and Gaps. This is the most important aspect of MTC because confirming that you have a bullish chart pattern in (say) the 60 minute chart means your end of day trade has that much more chance of rallying at the open, giving it that much more clearance from your entry.
Chart patterns provide one level of MTC confirmation, but you can also use indicators. Whether you are trading /investing with moving averages, RSI, Stochastics, MACD or any other basic movement indicator, seeing the values above and below your trading timeframe provides an extra level of confirmation. For example, a rising MACD Histogram indicates strength. If you plot this indicator in multiple timeframes, and confirm that it is rising in each of them, then you have further increased the chance of an upside move.
Three charts are presented below – a daily, weekly, and 60 minute chart for AAPL, depicting what happened on November 6 and 9.


Daily: On this “signal” day in the Daily Chart, MACD Histogram is increasing, there is a gap, and the market is moving up through the moving averages.

60 Minutes: On November 6, the markets were turning up off our moving averages. We also have a consolidation formed over the past 2 sessions. Consolidations are continuation patterns so this pattern indicates the probability of a continued up-move.
All three timeframes showed bullish sentiment. AAPL rose 5% to the end of November. MTC works because the participants in each timeframe have different trading horizons. In the daily chart, you primarily have short term investors with holding time horizons of 1-3 weeks. In the weekly chart, longer term investors are working to establish investments lasting months. Dropping to the 60 minute chart, you have the trading market acting on the stock during the session, creating a technical psychology that fuels movement. When all three participants (short, medium, and long term) are acting on a stock to drive it up, the chance of continued rally in all timeframes is increased.
Multiple Timeframe Confirmation is a powerful tool for confirming direction and trend before entering any trade/investment. Regardless of the platform you use, applying the principle of MTC can dramatically improve your results. If you display charts in several timeframes at the same time and confirm across them, you will definitely gain an edge in your trading.
Thursday, December 10, 2009
Can The Technology Sector Offer You Some Warming Profits This Winter?
Years ago, it was easy to point to the months between October and February as historically a period of out-performance for technology stocks. Now, this period has reduced by two months, making November through January the best period for technology sector stocks.
Over almost two decades, observing Fidelity’s Select Technology funds and the NYSE Arca Tech 100 Index, technology’s seasonal outperformance pattern is compelling. Currently, several factors are making tech’s prospects a promising investment opportunity. For one thing, technology names are much cheaper than they have been since the last bubble burst.
Usually, the fourth quarter is when corporate spending on new technology picks up. Corporate managers tend to hold some money in reserve. That unspent money has to be used in the fourth quarter or, when budget time comes around in the next fiscal year, there’s a high likelihood that efficiency experts may cut that budget.
This sales surge means during the fourth quarter tech company profits will likely be going up, and tech stocks in general should rise on the expectation of higher, accelerating earnings. Another factor that will be boosting the tech. sector is recovering emerging markets.
Lastly, as with many industries, hardware companies often end their production runs and begin recouping for new products during the beginning of the fourth quarter. This means that any inventory left on the shelf suddenly becomes much cheaper as companies drop prices to clear it out, and to make a last final attempt to increase their inventory turnover. Many company purchasers who don’t need to have the most recent tech. wait for the final months of the year to buy this late-model equipment at a steep discount.
The techno-surge finally ends as technology companies rebuild inventories and a new purchasing cycle begins. This is in the early spring, when technology stocks don’t fall into any particular profitable pattern that we can historically rely on.
Over the long run, several years plus, buying the technology sector in early November and selling at the end of January proves to be a beneficial, profitable strategy (losing in only 36% of the periods). Also, this simple strategy has offered average gains of 16-18%, pretty good for only a 4 month period. If you do decide to take a small tech stake, be sure to exit all of your tech. position come February 1st using this strategy.
Keep in mind that this is a short term strategy towards long-term investment gains. So do not be upset if you lose in the tech sector this next period for this strategy, because you should implement this strategy year-after-year to be consistently profitable in the long-term. It is much more likely that you will be profitable and see nice gains if you use this strategy for several years, rather than just one. If you would like more information on this I.M. me at sleyca (Yahoo messenger), email @ wlemerond@sleycapitallp.com, or call me at 262-939-8885
Wednesday, December 9, 2009
Currency Market Sentiment - Usually the Trend Is Your Friend, Until That Trend Becomes Overcrowded
When investing, in-depth knowledge of the current sentiment is a very valuable tool. Market sentiment is simply the overall mood or feeling of investors towards a specific market. The greater the mood or feeling in one direction, such as 90% of investors are long or have bought a specific market, then the greater the market sentiment significance.
When market sentiment is near or at extremes this has historically been a powerful indicator of market reversals and trend changes. For example, if 95% of investors are buying gold and gold has been rising in value, then this is an early warning that Gold should experience a pullback, and a downward trend is near.
The currency markets are one of the best markets to take advantage of market sentiment as a contrarian indicator because of their trending and volatile nature.
You should focus on market sentiment when it is nearing or at extremes, because this is the signal for you to either decrease your position in that market, or take the opposing view (contrarian) and bet against the trend. You can also use sentiment measures as indicators of market bubbles, helping you avoid the inevitable pop.
We Use Two Powerful Tools for Gauging Currency Sentiment:
SSI- This measure is called the speculative sentiment index. As its name implies, it is an index that tracks the current sentiment of a market. The SSI uses broker order flows, and is updated usually twice per week, giving investors/traders a constantly updating measure, percentage, of how many investors/traders are buying or selling a certain currency.
COT- This report, Commitment Of Traders, is published every Friday by the C.F.T.C. The COT measures the net long and short positions taken by traders in the futures markets. It is a great resource to gauge sentiment of the very large market speculators or investors including banks, hedge funds, financial institutions, and companies. Due to their large positions they are required to report to the government, which then compiles this reporting into the COT.
Most Recent SSI:
EURUSD - The ratio of long to short positions in the EURUSD stands at 1.74 as nearly 63% of traders are long. Yesterday, the ratio was at 1.82 as 65% of open positions were long. In detail, long positions are 5.2% lower than yesterday and 98.6% stronger since last week. Short positions are 0.5% lower than yesterday and 33.1% weaker since last week. Open interest is 3.5% weaker than yesterday and 11.5% above its monthly average. The SSI signals more EURUSD losses, or Dollar strengh against the EURO.
GBPUSD - The ratio of long to short positions in the GBPUSD stands at 2.01 as nearly 67% of traders are long. Yesterday, the ratio was at 2.11 as 68% of open positions were long. In detail, long positions are 3.0% lower than yesterday and 65.1% stronger since last week. Short positions are 2.0% higher than yesterday and 51.9% weaker since last week. Open interest is 1.4% weaker than yesterday and 3.7% below its monthly average. The SSI signals more GBPUSD losses, or Dollar strength against the British Pound.
GBPJPY - The ratio of long to short positions in the GBPJPY stands at 2.07 as nearly 67% of traders are long. Yesterday, the ratio was at 1.76 as 64% of open positions were long. In detail, long positions are 8.9% higher than yesterday and 30.0% stronger since last week. Short positions are 7.4% lower than yesterday and 25.7% weaker since last week. Open interest is 3.0% stronger than yesterday and 5.5% above its monthly average. The SSI signals more GBPJPY losses, or Japanese Yen strength against the British Pound.
USDJPY - The ratio of long to short positions in the USDJPY stands at 2.70 as nearly 73% of traders are long. Yesterday, the ratio was at 2.31 as 70% of open positions were long. In detail, long positions are 5.9% higher than yesterday and 11.0% weaker since last week. Short positions are 9.7% lower than yesterday and 17.5% weaker since last week. Open interest is 1.1% stronger than yesterday and 13.6% below its monthly average. The SSI signals more USDJPY losses, or Japanese Yen strength against the U.S. Dollar.
USDCAD - The ratio of long to short positions in the USDCAD stands at 1.42 as nearly 59% of traders are long. Yesterday, the ratio was at 1.08 as 52% of open positions were long. In detail, long positions are 9.7% higher than yesterday and 14.0% weaker since last week. Short positions are 16.6% lower than yesterday and 46.8% weaker since last week. Open interest is 3.0% weaker than yesterday and 12.0% below its monthly average. The SSI signals more USDCAD losses, or Canadian Loonie strength against the U.S. Dollar.
USDCHF - The ratio of long to short positions in the USDCHF stands at 1.02 as nearly 51% of traders are long. Yesterday, the ratio was at 1.12 as 53% of open positions were long. In detail, long positions are 4.1% lower than yesterday and 41.6% weaker since last week. Short positions are 5.3% higher than yesterday and 65.4% stronger since last week. Open interest is 0.3% stronger than yesterday and 11.2% below its monthly average. The SSI signals more USDCHF losses, or Swiss Franc strength against the U.S. Dollar.
AUDUSD - The ratio of long to short positions in the AUDUSD stands at 1.27 as nearly 56% of traders are long. Yesterday, the ratio was at 1.39 as 58% of open positions were long. In detail, long positions are 0.4% higher than yesterday and 52.8% stronger since last week. Short positions are 10.1% higher than yesterday and 14.4% weaker since last week. Open interest is 4.5% stronger than yesterday and 10.6% above its monthly average. The SSI signals more AUDUSD losses, or U.S. Dollar strength against the Australian Dollar.
NZDUSD - The ratio of long to short positions in the NZDUSD stands at 1.29 as nearly 56% of traders are long. Yesterday, the ratio was at 1.67 as 63% of open positions were long. In detail, long positions are 6.6% lower than yesterday and 8.2% weaker since last week. Short positions are 21.5% higher than yesterday and 5.4% weaker since last week. Open interest is 3.9% stronger than yesterday and 4.8% below its monthly average. The SSI signals more NZDUSD losses, or U.S. Dollar strength against the New Zealand Kiwi.
Interpreting the SSI:
The SSI is based on broker, proprietary, customer flow information and is a contrarian indicator designed to recognize price trend breaks and reversals in the four major currency pairs. The absolute number of the ratio itself represents the amount by which longs exceed shorts or vice versa. For example if the EURUSD ratio is 2.55, long customer orders exceed short orders by a ratio of 2.55 to 1.
Most Recent COT:
Speculators have started to cover US dollar short positions, or are basically closing out positions or bets on US dollar weakness. This most recent COT data warns of a trend change towards US dollar strength.

The COT Index is the percentile of the difference between net speculative positioning and net commercial positioning measured over a specific number of weeks, either 52 or 13. A reading close to 0 suggests that a bottom is forming and a reading close to 100 suggests that a top is forming in a specific currency. For example, a reading of 100 on the Canadian Dollar suggests that the Canadian Dollar stength is close to a top, which means pairs such as the USDCAD or EURCAD are close to a bottom.
Readings of 95 and higher as well as 5 and lower are in boldfaced red type, indicating market sentiment extremes. When the COT for a specific currency reaches these extremes the risk of a reversal in the preceding trend increases dramatically.
So What Currency Pairs Should You Potentially Invest In Based On The Current Market Sentiment?
Overall, the current market sentiment suggests general dollar strength to come; however, there are a few currencies that the dollar is most likely to strengthen against based on the most recent sentiment measures.
Short GBP/USD - Based on the current market sentiment you should short the GBP/USD, because contrarian sentiment indicators suggest dollar strength against the British Pound. According to the SSI nearly 67% of traders are long this pair, and according to the COT report, British Pound strength has just reached an extreme top. Both of these sentiment measures are among the most extreme for the British Pound/US Dollar pair.
Short EUR/CHF- Crosses are basically multiples of base pairs, which means that the EUR/CHF is actually the EUR/USD times the USD/CHF. Both the SSI and COT report suggest further Dollar strength to come against the Euro, which mean the EUR/USD should drop. Also, both of these cotrarian sentiment indicators suggests Swiss Franc strength to come against the Dollar, which means the USD/CHF should drop. If both the EUR/USD and USD/CHF should drop, then consequentially the EUR/CHF will drop.
Keep in mind that these contrarian indicators should be utilized for short to medium-term investments, and you should always implement prudent risk management such as stop-losses and leverage control. You can invest in the above mentioned currency pairs through either the spot (OTC) markets, or futures markets.
If you would like any more information on this subject and would like some guidance as to exactly how you can take positions based on the above suggestions then please call me at 262-939-8885.
When market sentiment is near or at extremes this has historically been a powerful indicator of market reversals and trend changes. For example, if 95% of investors are buying gold and gold has been rising in value, then this is an early warning that Gold should experience a pullback, and a downward trend is near.
The currency markets are one of the best markets to take advantage of market sentiment as a contrarian indicator because of their trending and volatile nature.
You should focus on market sentiment when it is nearing or at extremes, because this is the signal for you to either decrease your position in that market, or take the opposing view (contrarian) and bet against the trend. You can also use sentiment measures as indicators of market bubbles, helping you avoid the inevitable pop.
We Use Two Powerful Tools for Gauging Currency Sentiment:
SSI- This measure is called the speculative sentiment index. As its name implies, it is an index that tracks the current sentiment of a market. The SSI uses broker order flows, and is updated usually twice per week, giving investors/traders a constantly updating measure, percentage, of how many investors/traders are buying or selling a certain currency.
COT- This report, Commitment Of Traders, is published every Friday by the C.F.T.C. The COT measures the net long and short positions taken by traders in the futures markets. It is a great resource to gauge sentiment of the very large market speculators or investors including banks, hedge funds, financial institutions, and companies. Due to their large positions they are required to report to the government, which then compiles this reporting into the COT.
Most Recent SSI:
EURUSD - The ratio of long to short positions in the EURUSD stands at 1.74 as nearly 63% of traders are long. Yesterday, the ratio was at 1.82 as 65% of open positions were long. In detail, long positions are 5.2% lower than yesterday and 98.6% stronger since last week. Short positions are 0.5% lower than yesterday and 33.1% weaker since last week. Open interest is 3.5% weaker than yesterday and 11.5% above its monthly average. The SSI signals more EURUSD losses, or Dollar strengh against the EURO.
GBPUSD - The ratio of long to short positions in the GBPUSD stands at 2.01 as nearly 67% of traders are long. Yesterday, the ratio was at 2.11 as 68% of open positions were long. In detail, long positions are 3.0% lower than yesterday and 65.1% stronger since last week. Short positions are 2.0% higher than yesterday and 51.9% weaker since last week. Open interest is 1.4% weaker than yesterday and 3.7% below its monthly average. The SSI signals more GBPUSD losses, or Dollar strength against the British Pound.
GBPJPY - The ratio of long to short positions in the GBPJPY stands at 2.07 as nearly 67% of traders are long. Yesterday, the ratio was at 1.76 as 64% of open positions were long. In detail, long positions are 8.9% higher than yesterday and 30.0% stronger since last week. Short positions are 7.4% lower than yesterday and 25.7% weaker since last week. Open interest is 3.0% stronger than yesterday and 5.5% above its monthly average. The SSI signals more GBPJPY losses, or Japanese Yen strength against the British Pound.
USDJPY - The ratio of long to short positions in the USDJPY stands at 2.70 as nearly 73% of traders are long. Yesterday, the ratio was at 2.31 as 70% of open positions were long. In detail, long positions are 5.9% higher than yesterday and 11.0% weaker since last week. Short positions are 9.7% lower than yesterday and 17.5% weaker since last week. Open interest is 1.1% stronger than yesterday and 13.6% below its monthly average. The SSI signals more USDJPY losses, or Japanese Yen strength against the U.S. Dollar.
USDCAD - The ratio of long to short positions in the USDCAD stands at 1.42 as nearly 59% of traders are long. Yesterday, the ratio was at 1.08 as 52% of open positions were long. In detail, long positions are 9.7% higher than yesterday and 14.0% weaker since last week. Short positions are 16.6% lower than yesterday and 46.8% weaker since last week. Open interest is 3.0% weaker than yesterday and 12.0% below its monthly average. The SSI signals more USDCAD losses, or Canadian Loonie strength against the U.S. Dollar.
USDCHF - The ratio of long to short positions in the USDCHF stands at 1.02 as nearly 51% of traders are long. Yesterday, the ratio was at 1.12 as 53% of open positions were long. In detail, long positions are 4.1% lower than yesterday and 41.6% weaker since last week. Short positions are 5.3% higher than yesterday and 65.4% stronger since last week. Open interest is 0.3% stronger than yesterday and 11.2% below its monthly average. The SSI signals more USDCHF losses, or Swiss Franc strength against the U.S. Dollar.
AUDUSD - The ratio of long to short positions in the AUDUSD stands at 1.27 as nearly 56% of traders are long. Yesterday, the ratio was at 1.39 as 58% of open positions were long. In detail, long positions are 0.4% higher than yesterday and 52.8% stronger since last week. Short positions are 10.1% higher than yesterday and 14.4% weaker since last week. Open interest is 4.5% stronger than yesterday and 10.6% above its monthly average. The SSI signals more AUDUSD losses, or U.S. Dollar strength against the Australian Dollar.
NZDUSD - The ratio of long to short positions in the NZDUSD stands at 1.29 as nearly 56% of traders are long. Yesterday, the ratio was at 1.67 as 63% of open positions were long. In detail, long positions are 6.6% lower than yesterday and 8.2% weaker since last week. Short positions are 21.5% higher than yesterday and 5.4% weaker since last week. Open interest is 3.9% stronger than yesterday and 4.8% below its monthly average. The SSI signals more NZDUSD losses, or U.S. Dollar strength against the New Zealand Kiwi.
Interpreting the SSI:
The SSI is based on broker, proprietary, customer flow information and is a contrarian indicator designed to recognize price trend breaks and reversals in the four major currency pairs. The absolute number of the ratio itself represents the amount by which longs exceed shorts or vice versa. For example if the EURUSD ratio is 2.55, long customer orders exceed short orders by a ratio of 2.55 to 1.
Most Recent COT:
Speculators have started to cover US dollar short positions, or are basically closing out positions or bets on US dollar weakness. This most recent COT data warns of a trend change towards US dollar strength.
The COT Index is the percentile of the difference between net speculative positioning and net commercial positioning measured over a specific number of weeks, either 52 or 13. A reading close to 0 suggests that a bottom is forming and a reading close to 100 suggests that a top is forming in a specific currency. For example, a reading of 100 on the Canadian Dollar suggests that the Canadian Dollar stength is close to a top, which means pairs such as the USDCAD or EURCAD are close to a bottom.
Readings of 95 and higher as well as 5 and lower are in boldfaced red type, indicating market sentiment extremes. When the COT for a specific currency reaches these extremes the risk of a reversal in the preceding trend increases dramatically.
So What Currency Pairs Should You Potentially Invest In Based On The Current Market Sentiment?
Overall, the current market sentiment suggests general dollar strength to come; however, there are a few currencies that the dollar is most likely to strengthen against based on the most recent sentiment measures.
Short GBP/USD - Based on the current market sentiment you should short the GBP/USD, because contrarian sentiment indicators suggest dollar strength against the British Pound. According to the SSI nearly 67% of traders are long this pair, and according to the COT report, British Pound strength has just reached an extreme top. Both of these sentiment measures are among the most extreme for the British Pound/US Dollar pair.
Short EUR/CHF- Crosses are basically multiples of base pairs, which means that the EUR/CHF is actually the EUR/USD times the USD/CHF. Both the SSI and COT report suggest further Dollar strength to come against the Euro, which mean the EUR/USD should drop. Also, both of these cotrarian sentiment indicators suggests Swiss Franc strength to come against the Dollar, which means the USD/CHF should drop. If both the EUR/USD and USD/CHF should drop, then consequentially the EUR/CHF will drop.
Keep in mind that these contrarian indicators should be utilized for short to medium-term investments, and you should always implement prudent risk management such as stop-losses and leverage control. You can invest in the above mentioned currency pairs through either the spot (OTC) markets, or futures markets.
If you would like any more information on this subject and would like some guidance as to exactly how you can take positions based on the above suggestions then please call me at 262-939-8885.
Tuesday, December 8, 2009
What Can Save The Dollar?
The dollar's weakness over the past several months has been directly related to the modest net capital outflows from the United States, most of these outflows came from the domestic banking sector, and the strength of the U.S. equities markets. Some of these outflows are the results of an unwinding of the panic-driven inflows of last autumn, which was a great period of dollar strength. Both foreign purchases of U.S. Treasury bills and dollar liquidity surged when the global financial system was on the cusp of collapse, and there was a flight to safety.
Investors have now been liquidating their holdings of safe, but low-yielding, T-bills over the past several months in favor of higher rates of return that can be found in higher yielding foreign countries, emerging markets, and the domestic equities markets. Also, net purchases of long-term U.S. securities has decreased due entirely to fewer foreign purchases of agency securities and securitized assets. Lastly, the majority of the net capital outflows are a result of a substantial increase in foreign lending by U.S. banks, totaling nearly $300 Billion in the last 4 months.
What can reverse the dollar's recent slide?
There are several developments that have the potential to lead to a stronger dollar. First, a return of risk aversion among investors would lead to higher foreign purchases of U.S. Treasury bills and a reduction in U.S. bank lending to foreign borrowers. Another fundamental change that can produce sustained dollar appreciation would be an increase in rates of return on U.S. assets. This increase in U.S. interest rates would be signaled early by a run of stronger-than-expected U.S. economic data, which would raise hopes that the recent bounce in U.S. economic activity will turn into a sustainable recovery. Higher rates of return on dollar assets from an increase in interest rates usually attracts capital inflows that lead to dollar appreciation.
Technical factors are against the dollar at the moment, including a weakening trend. If the dollar index can print a weekly close above the $76.50 level, which it is very near, this will be a signal technically for more dollar strength. This level would signal a change in the trend, and a break of significant resistance levels, which would lead to strong dollar short covering. Dollar risks remain if indications arise that the United States is not serious about addressing its fiscal challenges, which could be the catalyst that causes foreigners to significantly reduce their purchases of Treasury securities. Currently, we believe that conditions are shaping up for some good medium term dollar strength.
Monday, December 7, 2009
Perhaps The Most Important Area Of Investing - Psychology
When you are striving for investment and financial excellence, you will have to do so by overcoming some tough obstacles. When you focus on the financial or investing problems you have, you are most likely going to generate feelings of guilt, anger or frustration in yourself. These feelings that arise are the silent investment account and financial killers; when investing you need to invest emotionless, which will help you focus on facts and not just gut feelings or instinct. Little investment or financial success is reached from such mental states, because they leave you feeling stuck and your “stuck” mode tends to persist and cause you to irrationally manage your finances and investments.
Anything you cannot accomplish is due to a stuck state. Any failure event in your past produces a psychological stop sign in front of you whenever you start in certain directions. This psychological stop sign has an impact that is as strong on you as the original failure, and creates internal conflicts when you attempt to accomplish a certain task, part of you wants to try and another part wants to retreat. You go back and forth, in a stuck state of mind, directionless and not creating any progress towards your goal, and this may also lead to procrastination.
This same stuck state of mind for an investor is devastating. One part of the investor says “I am losing money, I should cut my losses short, stick to my original plan and time frame, and look for the next investment"(Would be the wise decision) Another part says, “Stay in the investment, it should come back, maybe, and you don’t want to book a loss now.” (Wrong Choice)
Every time we put something off, some dream or goal, our feelings start to oscillate. We want to achieve our dream or goal, but we also want to avoid the pain that it takes to accomplish the task. The result is e-motion—a lack of motion outside and an intense motion inside of ourselves. This emotional feeling in investing is the fear of booking a loss because that would mean we would have to invest again after losing,and individuals then get scared to make another investment because they remember the previous losses. The most successful investors and traders in the world will agree that it is essential to mute emotions, cut losses short, and to not ever fall into a false sense of security based on a feeling, such as "The market should come back" and altering your original investment plan or time frame just because you have a loss on one investment.
Simple Solutions:
When you are stuck, the more effort you put into trying to move forward, the worse off you become. One solution to this is always to relax and often move slightly in the direction that is opposite to what your instincts tell you., and try to falsify every idea that you have and always using facts when investing.
If you are stuck in your goal of becoming an excellent investor, try doing the opposite of your instincts. Understand that if your original plan was to be invested and profitable within 10 years, it is perfectly acceptable, and the wiser investment decision, to take a loss now and then look for the next opportunity. You should put great efforts towards working on your emotions, and being able to control them when it comes to your investments and finances.
A second solution is to focus on what you want, and can achieve. When you focus on limitations, problems,, and the things you do not want to happen you feel the emotions of the stop sign or the limitation. When you focus on what you want to achieve, then you begin to see possibilities and new resources that open you up, and begin to improve upon your strengths.
Finally, the third solution is to focus on being what you want to be. If you want to be a great investor, don’t focus on what they have or even do, focus on their state of being, so you will really start investing like them. You need to think about, "What is it like to be a great, successful investor and really be in their shoes?"
Wednesday, December 2, 2009
The BOLD Moves Of Gold, And The SHY Moves Of Oil
Gold has had a nine-day winning streak, which was one of its best periods ever, as the dollar value weakened and world markets corrected. On Friday, gold was down $20.70 to $1,171.4/ounce. Gold actually hit an all-time record high of $1,195.80 overnight before selling off to $1,136.40, a huge $60 swing, though it then recovered all of those losses and has now rallied to another new high today of $1225/ounce.
Gold rallied almost 15% in November, which was its best month in ten years. It is time to reassess your position in gold, and you should really take most, if not all, of any profits you may have in this asset class. We are now moderately above $1,200/ounce, and although $1,300/ounce is possible in the short-term, the odds of hitting it are diminishing daily and this is certainly not a time to be putting on new medium to long-term positions.
Also, you must consider the extremely high volatility this asset class has been experiencing, usually a predecessor to a large sharp move down, which I am sure you do not want to be part of. $1,250 to $1,300 potential still exists, but unless we break upwards very shortly, it is not likely to happen. Even if you are a very long-term investor, we still believe and our analysis of the gold markets stress that you have very high odds of seeing a substantially lower price (we have an outlook for gold to hit at least $1,000/ounce, 18% lower in the medium term), which is where you can add to your position.
If gold does retrace back to $1,000 or under like we believe it will, it could become quite disconcerting for you that you didn't take something off the table at these current prices where we are suggesting that you decrease your gold exposure.
US crude oil production is nearing its biggest year-on-year jump since 1970. If the 5.27 million barrels a day of average production level, recorded in the first ten months of the year, holds through December, this year's output will rise 6.4% from 2008, the Platts analysis of Energy Information Administration data showed.
This year's production level will be the highest since 2004, when output averaged 5.419 million barrels a day. Peak oil production was recorded in 1970, when the US produced 9.637 million barrels of oil. All of these fundamentals have yet to be reflected in oil prices. Oil is still following the dollar and it will take a nice dollar and equities breakout for oil to really move and find some direction.
Tuesday, December 1, 2009
A Simple Option Strategy
Why Would You Invest Using Options?
Options are a right to buy or sell a security at a specific price and date. Options give you great control over your risk, and the strategy you use. Lastly, options provide you a way to hedge your investments and take advantage of volatile markets.
A Simple Option Strategy If You Believe A Stock Will Rise:
If you believe the value of a stock will rise then you have two options: a bull put (vertical put sell or credit put spread) or a bull call (vertical call buy or debit call spread). Check the price of the premium in order to determine which of the strategies to utilize; this will help you avoid over-premium pricing.
Implied volatility (VIX) is the main determinant of a high premium. Therefore, you should let the implied volatility determine which strategy you should use. Choose a vertical debit spread (bullish or bearish, depending on my outlook) if the implied volatility is low. In contrast, if there is currently a high implied volatility then you should not be a buyer of options, but you should rather implement a vertical credit spread, which includes either a bear call or a bull put.
So how do you implement a vertical credit spread if there is high implied volatility?
Bull Put
A bull put requires you to buy one option first and then simultaneously selling another one at a different strike price on the same underlying for the same expiration month. A bull put is a credit spread in which the price paid for the long put option is less than the premium received for the short put, which in the end produces a net credit. At expiration, the maximum value of the spread is equal to the difference between both strike prices.
Here is an example of a bull put where you are buying one put and then selling another put with a higher strike price (lower-strike put always costs less than the higher-strike price). If the underlying is at 39 and the trader has an outlook that is neutral to bullish, then the trader could select the below strike prices, buying the 35 put and selling the higher strike price, or 40 put.

(click to enlarge)
In the example above prices are assigned premiums to the two strike prices in order to point out that the maximum profit on this vertical credit put spread is $150 excluding commissions. The goal of a bull put is to maximize the amount of net credit.
Risk, as always, must be considered in this investment. Since the maximum value of a spread at the expiration is equal to the difference between the strike prices, then the max loss is equal to to strike price differences minus the credit. In the above example the value of the strike price differences is $500, and the max credit is $150, then our the max loss is $350.
This trade has three possible outcomes:

(click to Enlarge)
In the worst case scenario the underlying stock price would drop below the lower (bought) strike price, and you would suffer the max loss. However, to help avoid this you should be monitoring your bull put position actively and observe that the price is dropping. When you see that the price is dropping you should close the spread which will allow you to recover whatever value is left in the spread.
This trade is on the positive side when the price of the underlying goes above the sold put. Again the goal is to keep as much of the net credit as possible.If the underlying closes in between the two strike prices, then you will receive a profit "in-between" zero and the maximum. In such a situation, you should be concerned about how near the underlying price is to the bought put. The break-even point is the difference between the higher put strike price and the credit received.
In conclusion, you should understand how to use the credit put, and remember that the selling of the credit put should only be done when the implied volatility of the underlying is high (use moving averages or the 52-week high), or at least in the higher range. Also, you should implement a debit spread when implied volatility is low.
Options are a right to buy or sell a security at a specific price and date. Options give you great control over your risk, and the strategy you use. Lastly, options provide you a way to hedge your investments and take advantage of volatile markets.
A Simple Option Strategy If You Believe A Stock Will Rise:
If you believe the value of a stock will rise then you have two options: a bull put (vertical put sell or credit put spread) or a bull call (vertical call buy or debit call spread). Check the price of the premium in order to determine which of the strategies to utilize; this will help you avoid over-premium pricing.
Implied volatility (VIX) is the main determinant of a high premium. Therefore, you should let the implied volatility determine which strategy you should use. Choose a vertical debit spread (bullish or bearish, depending on my outlook) if the implied volatility is low. In contrast, if there is currently a high implied volatility then you should not be a buyer of options, but you should rather implement a vertical credit spread, which includes either a bear call or a bull put.
So how do you implement a vertical credit spread if there is high implied volatility?
Bull Put
A bull put requires you to buy one option first and then simultaneously selling another one at a different strike price on the same underlying for the same expiration month. A bull put is a credit spread in which the price paid for the long put option is less than the premium received for the short put, which in the end produces a net credit. At expiration, the maximum value of the spread is equal to the difference between both strike prices.
Here is an example of a bull put where you are buying one put and then selling another put with a higher strike price (lower-strike put always costs less than the higher-strike price). If the underlying is at 39 and the trader has an outlook that is neutral to bullish, then the trader could select the below strike prices, buying the 35 put and selling the higher strike price, or 40 put.
(click to enlarge)
Risk, as always, must be considered in this investment. Since the maximum value of a spread at the expiration is equal to the difference between the strike prices, then the max loss is equal to to strike price differences minus the credit. In the above example the value of the strike price differences is $500, and the max credit is $150, then our the max loss is $350.
This trade has three possible outcomes:
(click to Enlarge)
This trade is on the positive side when the price of the underlying goes above the sold put. Again the goal is to keep as much of the net credit as possible.If the underlying closes in between the two strike prices, then you will receive a profit "in-between" zero and the maximum. In such a situation, you should be concerned about how near the underlying price is to the bought put. The break-even point is the difference between the higher put strike price and the credit received.
In conclusion, you should understand how to use the credit put, and remember that the selling of the credit put should only be done when the implied volatility of the underlying is high (use moving averages or the 52-week high), or at least in the higher range. Also, you should implement a debit spread when implied volatility is low.
Friday, November 27, 2009
A Shallow But Turbulent, Squeezing Week For The Markets
Upward pressures from market bulls managed to send the major financial indexes higher in the early part of this past week. However, the majority of the rally was unsustainable, and the momentum diminished in the latter part of the week. Mixed economic data and technical market conditions caused traders to question the strength of the recent market rebound of the last several months.
Observing the S&P 500 chart, represented by the S&P 500 SPDRS (NYSE:SPY) ETF, the 111.30 level acted as a strong resistance level. This resistance coupled with other technical conditions of the S&P, suggest a larger correction is imminent. Currently, the S&P is trading within a well established uptrend and there will be short term upward pressures until the S&P ETF closes below the support of the ascending trendline near the 106 level, or the S&P index closes below 1,065.

The iShares Russell 2000 Index (NYSE:IWM) ETF continues to show negative signs. IWM recently established a short term downtrend, and has not had enough strength to break above its October higher like its larger-cap counterparts. Many traders will watch for the index to find support at its mid to long-term moving averages. There is not any good support levels between the current level and the significant moving averages, which are currently near $50-55. This chart suggests a larger pullback, and a test of major support levels.

The Powershares QQQ ETF (Nasdaq:QQQQ) was hit hard in the second half of the week. The lackluster earnings report from Dell Inc. (NYSE:DELL) didn't help the case for a move higher. However, the diverging moving averages shown on the chart are a clear indication that the long-term uptrend in technology stocks is still intact.

The Dow Jones Industrial Average(^DJI) has not had any real direction this past week and has been in the choppy, range-bound motion that we had suggested would occur this week due to low volume, economic data, and significant technical chart levels. The chart below shows the DOW has recently touched it's upper trendline resistance (blue line) suggesting now a test of it's lower support level. Also, the pattern that is shown on the chart below is technically called an "inclining wedge" and is generally bearish.
Short-term support for the DOW comes in at 10,050 (UPPER CIRCLE) which is the lower trendline of the wedge (blue) and is also where the 20-day moving average (upper red, wavy line) lies. A break below this 10,050 level should lead the markets to a larger, medium-term correction, near the 9,000 level (LOWER CIRCLE). This 9,000 level is the current area for the 200-day moving average, 38% fibonacci retracement, and June resistance now turned support.

We suggest that you be very cautious with your investments at these current market levels, either take some profits and allocate more of your assets into fixed income, or hedge some of your investments. We still maintain our short-medium term bearishness and outlook for a medium term 10-15% drop in the DOW, and very similar in the other major indices.
Observing the S&P 500 chart, represented by the S&P 500 SPDRS (NYSE:SPY) ETF, the 111.30 level acted as a strong resistance level. This resistance coupled with other technical conditions of the S&P, suggest a larger correction is imminent. Currently, the S&P is trading within a well established uptrend and there will be short term upward pressures until the S&P ETF closes below the support of the ascending trendline near the 106 level, or the S&P index closes below 1,065.

The iShares Russell 2000 Index (NYSE:IWM) ETF continues to show negative signs. IWM recently established a short term downtrend, and has not had enough strength to break above its October higher like its larger-cap counterparts. Many traders will watch for the index to find support at its mid to long-term moving averages. There is not any good support levels between the current level and the significant moving averages, which are currently near $50-55. This chart suggests a larger pullback, and a test of major support levels.

The Powershares QQQ ETF (Nasdaq:QQQQ) was hit hard in the second half of the week. The lackluster earnings report from Dell Inc. (NYSE:DELL) didn't help the case for a move higher. However, the diverging moving averages shown on the chart are a clear indication that the long-term uptrend in technology stocks is still intact.

The Dow Jones Industrial Average(^DJI) has not had any real direction this past week and has been in the choppy, range-bound motion that we had suggested would occur this week due to low volume, economic data, and significant technical chart levels. The chart below shows the DOW has recently touched it's upper trendline resistance (blue line) suggesting now a test of it's lower support level. Also, the pattern that is shown on the chart below is technically called an "inclining wedge" and is generally bearish.
Short-term support for the DOW comes in at 10,050 (UPPER CIRCLE) which is the lower trendline of the wedge (blue) and is also where the 20-day moving average (upper red, wavy line) lies. A break below this 10,050 level should lead the markets to a larger, medium-term correction, near the 9,000 level (LOWER CIRCLE). This 9,000 level is the current area for the 200-day moving average, 38% fibonacci retracement, and June resistance now turned support.

The action this past week clearly shows that the strength of the market rally continue to be in question and seems to be diminishing, paving the way for a downward breakout. The late-week pullback has caused many to wonder if the rally is running out of steam and if a larger correction is nearby, or if this is a brief period of consolidation before another leg higher.
We suggest that you be very cautious with your investments at these current market levels, either take some profits and allocate more of your assets into fixed income, or hedge some of your investments. We still maintain our short-medium term bearishness and outlook for a medium term 10-15% drop in the DOW, and very similar in the other major indices.
Wednesday, November 25, 2009
Housing Roars, While Financials Sleep
New home sales rose last month to the highest level in more than a year, largely due to strong activity in the South and the new home buyer tax credit possibly coming to an end last month (was extended to April 30,2010).
The Commerce Department said Wednesday that sales rose 6.2 percent to a seasonally adjusted annual rate of 430,000 from an upwardly revised 405,000 in September. Economists surveyed by Thomson Reuters had expected a pace of 410,000. The report tracks signed contracts to buy homes, rather than completed sales.
The surge in new home sales was driven entirely by a 23 percent increase in the South. Sales fell about 5 percent in the West and Northeast, and fell 20 percent in the Midwest. Despite the lack of certainty about the tax credit that buyers faced in October, sales were up 5.1 percent from a year ago, the first yearly increase since November 2005. The median sales price of $212,200 was almost even with $213,200 a year earlier, but up almost 1 percent from September's level of $210,700.
By scaling back on construction, the building industry has brought the oversupply of homes on the market under control. Currently, there is 6.7 months of supply of new homes for sale, which is a drop from last month and down from last winter's peak of more than a year.
Used home sales were reported to have rose 10 percent from September to October, the biggest monthly increase in a decade. Along with the tax credit, buyers are being attracted by low prices, low mortgage rates, and slightly higher personal income.
Financial Stocks Have Not Seen Much Action
Stocks in the financial sector have been settled down for several months after seeing high volatility during the market downfall of 2008. Financials recovered in early 2009 and a experienced a rally that lasted well into the Fall of 2009. Interest in financial has died down and they have been trading generally in a choppy sideways manner since the late August, early September period.
After analyzing financials there are some that show critical areas, and deserve your attention. The chart for the Financial Select Sector SPDR ETF (NYSE:XLF) is a general picture of what many of the bank stocks and financials look like. It has been trading in a very tight range recently, and the 20- and 50-day moving averages have practically turned sideways. This narrow range should be watched closely, because a break in either direction would lead to a continuation move and be the mid-term direction for financials.

Bank of America Corporation (NYSE:BAC) looks very similar to XLF but there is one apparent difference. While XLF respected the lower bounds of its trading range, BAC actually broke under the range in late October. However, there was no follow-through, and BAC was able to climb back into the base. This often ends up turning into a bear trap, but BAC would have to first clear the narrow trading range highlighted in red before the bears get nervous. A move below the narrow range could lead to a full-fledged breakdown and a test of the 200-day moving average in the $12-$13 range.

JPMorgan Chase and Co. (NYSE:JPM) is another financial stock that may be in a critical area. JPM has been gradually rolling over, and has begun to set lower highs. However, it is important to note that JPM hasn't broken support either, and remains entrenched in its current base. While the pattern is beginning to resemble a head-and-shoulders topping pattern, the pattern will not be valid until JPM closes beneath the neckline (highlighted in blue). The whole area between $40.50 and $42 is the level that needs to hold for JPM on a pullback.

Capital One Financial (NYSE:COF) is another financial stock with an interesting chart. COF has been showing some weakness, but it is still in it's main uptrend and is being held by several support levels. It attempted an upward breakout in October, but the rally failed. COF is now building a base and is riding the 50-day moving average. A move below the 50-day moving average would show greater weakness, and could provide the catalyst needed for a larger correction downward.

Putting It All Together
Although volume and trading in financials has been declining for a few months, it might be time for them to start seeing some action. While they are showing some near-term weakness, the fact that the markets continue to be in an intermediate uptrend must be taken into account when considering a financial stock investment. Volatility has diminished singnificantly in the financials, and it is likely the next move in the group will be large. As investor confidence in financials is determined this should provide an idea of where the major indices may be headed as financials can sometimes lead the markets.
The Commerce Department said Wednesday that sales rose 6.2 percent to a seasonally adjusted annual rate of 430,000 from an upwardly revised 405,000 in September. Economists surveyed by Thomson Reuters had expected a pace of 410,000. The report tracks signed contracts to buy homes, rather than completed sales.
The surge in new home sales was driven entirely by a 23 percent increase in the South. Sales fell about 5 percent in the West and Northeast, and fell 20 percent in the Midwest. Despite the lack of certainty about the tax credit that buyers faced in October, sales were up 5.1 percent from a year ago, the first yearly increase since November 2005. The median sales price of $212,200 was almost even with $213,200 a year earlier, but up almost 1 percent from September's level of $210,700.
By scaling back on construction, the building industry has brought the oversupply of homes on the market under control. Currently, there is 6.7 months of supply of new homes for sale, which is a drop from last month and down from last winter's peak of more than a year.
Used home sales were reported to have rose 10 percent from September to October, the biggest monthly increase in a decade. Along with the tax credit, buyers are being attracted by low prices, low mortgage rates, and slightly higher personal income.
Financial Stocks Have Not Seen Much Action
Stocks in the financial sector have been settled down for several months after seeing high volatility during the market downfall of 2008. Financials recovered in early 2009 and a experienced a rally that lasted well into the Fall of 2009. Interest in financial has died down and they have been trading generally in a choppy sideways manner since the late August, early September period.
After analyzing financials there are some that show critical areas, and deserve your attention. The chart for the Financial Select Sector SPDR ETF (NYSE:XLF) is a general picture of what many of the bank stocks and financials look like. It has been trading in a very tight range recently, and the 20- and 50-day moving averages have practically turned sideways. This narrow range should be watched closely, because a break in either direction would lead to a continuation move and be the mid-term direction for financials.


Capital One Financial (NYSE:COF) is another financial stock with an interesting chart. COF has been showing some weakness, but it is still in it's main uptrend and is being held by several support levels. It attempted an upward breakout in October, but the rally failed. COF is now building a base and is riding the 50-day moving average. A move below the 50-day moving average would show greater weakness, and could provide the catalyst needed for a larger correction downward.

Putting It All Together
Although volume and trading in financials has been declining for a few months, it might be time for them to start seeing some action. While they are showing some near-term weakness, the fact that the markets continue to be in an intermediate uptrend must be taken into account when considering a financial stock investment. Volatility has diminished singnificantly in the financials, and it is likely the next move in the group will be large. As investor confidence in financials is determined this should provide an idea of where the major indices may be headed as financials can sometimes lead the markets.
Monday, November 23, 2009
An Unfamous, Precious Commodity - Water
Water is something many people take for granted, seeming almost free and almost infinitely abundant. However, the fact is that water is one of the worlds most precious commodities, and does not receive the respect it deserves. A recent report has just revealed that water demand will increase nearly 50%in developed countries, and more than 50% in developing coutries, within the next 20 years.
So why is this commodity so precious & why should you be invested in it?
Buying water utilities is the best route to take for directly investing in water.Water utility stocks have on average outperformed the major market indices annualy, and cumulatively for the past several decades. Also, on an annualized basis, water utility stocks have been among the top performing domestic stocks for the past decade.
What water utilities to invest in now?
We have done some analysis and have decided upon the 2 water utility stocks we believe deserve your investment the most. They are: Consolidated Water Co. Ltd. (Nasdaq: CWCO) & Mueller Water Products Inc. (NYSE: MWA)
Both of these water utilities are very good long-term value buys at their current prices. CWCO has a very good net income growth trend, and is very efficient with much better than industry profit margins. CWCO also has extremely good liquidity, has recently been upgraded by analysts, and also is a small cap. stock which gives it tremendous room for future growth.
MWA has larger market capitalization and therefore, generally less risk, than CWCO so it may be an investment for a more conservative investor. However, MWA is in great position financially, particularly with their liquidity and debt management. Also, MWA is a great bargain at it's current price, and has technically broken above strong resistance levels which should give it an extra boost in the short to medium-term.
So why is this commodity so precious & why should you be invested in it?
- Only 3% of all the water on earth is drinkable,
- Of the 97% that is not drinkable, in order to make it drinkable will dramatically increase the costs of water, and in turn increase the values of water utility stocks,
- At the current rate, world water supplies will be depleted in only a few thousand years,
- Nearly 1/4 of the world population still does not have access to clean, drinkable water, and another 1/4 has very high water scarcity stress,
- Our water needs will aways be there and growing, unlike natural resources for energy where we can change from one source to another, we will always need to drink water and use it in our food.
Buying water utilities is the best route to take for directly investing in water.Water utility stocks have on average outperformed the major market indices annualy, and cumulatively for the past several decades. Also, on an annualized basis, water utility stocks have been among the top performing domestic stocks for the past decade.
What water utilities to invest in now?
We have done some analysis and have decided upon the 2 water utility stocks we believe deserve your investment the most. They are: Consolidated Water Co. Ltd. (Nasdaq: CWCO) & Mueller Water Products Inc. (NYSE: MWA)
Both of these water utilities are very good long-term value buys at their current prices. CWCO has a very good net income growth trend, and is very efficient with much better than industry profit margins. CWCO also has extremely good liquidity, has recently been upgraded by analysts, and also is a small cap. stock which gives it tremendous room for future growth.
MWA has larger market capitalization and therefore, generally less risk, than CWCO so it may be an investment for a more conservative investor. However, MWA is in great position financially, particularly with their liquidity and debt management. Also, MWA is a great bargain at it's current price, and has technically broken above strong resistance levels which should give it an extra boost in the short to medium-term.
Sunday, November 22, 2009
Does Your Portfolio Have Transportation?
Transportation is the back-bone of the world economy. Without transportation, raw materials cannot be shipped, and the end result is disasterous for the economy. With the world's major economies coming out of a recession transportation is sure to benefit. The transportation sector is comprised of airlines, railways, package carriers(trucking, postage), even oil and gas pipelines.
Why should you be invested in the transportation sector?
In reality, transportation is the most important sector of them all, and also is a great indicator/leader of the equities markets. This nature is due to the fact that growth or contraction in the transportation sector is an early signal for economic growth or contraction. Companies will begin producing more before hiring; therefore, transportation is an early indicator of mid to long-term economic growth because it benefits before companies increase their overhead labor costs.
It make sense that if more raw materials and finished product are being shipped, it means companies are producing more goods to satisfy business and consumer demand. This growth in the transportation sector is a good indication that the U.S. economy, or the rest of the globe is in good health and ready for a rebound.
It would make sense that when investing in a sector which has a great degree of costs, many sub-sectors, and is generally highly cyclical, you would to invest in the most EFFICIENT transportation system.
So what is the worlds most efficient transportation system?
It is U.S. intermodal, or integrated transportation. Here's why:
•Close to 40 million tons of goods are hauled around the United States every day.
•The total price of all the goods being shipped every day is $25-30 billion.
•Ground transportation is done on near 4,000,000 miles of highways and roads, 95,000 miles of railroads and 26,000 miles of waterways.
•U.S. shipping also includes thousands of miles of air routes and over 1.7 million miles of oil and gas pipelines.
•Accounts for close to $500 billion, or 4% of total GDP.
Intermodal shipping is highly efficient and more strategic. During the record high oil, diesel, and gasoline prices of 2008 the companies that survived and thrived the best were those that shifted their focus to intermodal shipping.
So what exactly is intermodal shipping?
Intermodal freight – a shipping method that combines rail, ship, and freight with very minimal handling of the freight during the switching of transportation modes, which reduces costs.
Intermodal freight shipping is down close to 20% in the past year. This drop is significantly due to the U.S. and world economic recessions.
So why should you consider investing in intermodal shipping companies now?
•Intermodal freight volumes have either been flat, or on the increase since June.
•Domestic container volumes have been rising slightly (up 1.3% during the third quarter).
A few other reasons why intermodal shipping will continue to do well includes the fact that the method is more cost-effective and environmentally friendly. For example, it uses 33% less fuel than shipping by truck alone. And most rail trains can move a ton of freight about 400 miles on a gallon of diesel, much more efficient than a truck.
So what companies stock is worth your attention to take advantage of intermodal shipping?
J.B. Hunt Transportation Services’(Nasdaq: JBHT) is a company that is in great position, taking advantage of the increased savings and higher margins intermodal shipping offers. CEO, Kirk Thompson, recently completed a new intermodal deal with Norfolk Southern Corp. (NYSE: NSC).
The multi-year contract will provide both companies a platform to accelerate the conversion of traditional truck traffic to intermodal transportation with service that is competitive with truckload moves. “The conversion of highway freight to the more efficient, cost-effective, safer and more environmentally friendly services that we jointly provide, will not only benefit shippers and the general public, but our shareholders alike,” said Hunt's CEO Kirk Thompson. The overall goal of the deal is to accelerate the switch from truck traffic to truck-rail intermodal transportation for freight shippers.
Both J.B. Hunt and Norfolk Southern are strong financially as well. J.B. Hunt's sales returns, ROA, ROE, net income, and liquidity are all much better than the transportation industry average. Norfolk Southern has recently had great management efficiency, and a solid trend for the last decade of rising profit margins, rising ROE, rising ROA, and decreasing debt.
The Hub Group (Nasdaq: HUBG), is another shipping company that deserves your attention, and it is a freight company specializing in intermodal services and logistics. Dave Yeager, CEO of The Hub Group agrees with the intermodal mode, recently mentioning “We believe that business conditions are better and have become more stable. The future remains bright for intermodal due to the excellent service, a cost advantage over trucks, and the environmental benefits.”
Ultimately, if you want to harness the power of the transporation sector benefiting from economic recovery and long term growth, consider investing in J.B. Hunt, Norfolk Southern, or The Hub Group. They all surely stand to benefit as the economy continues to rebound.
Saturday, November 21, 2009
Interesting Point For The Dollar & The Dow
How Will The Dollar Perform From Here?
The US dollar index closed below 75.75 on Friday, which is where there is a falling trendline resistance drawn from the July 2009 high. This implies that the long-term down trend line is holding strong and the currency’s downtrend remains in place, suggesting further weakness.
Not much action is expected for the dollar in this following week, US markets will be closed on Thursday for Thanksgiving and will be closed early on Friday. As a result, there will be lower than normal volumes, which may contribute to either flat price movements, choppy-rangebound trade, and no real direction. Since, event risk will be very high all week the rangebound, choppy trade is the most likely outcome of this next week.
Both technically and fundamentally, our outlook for the Dollar is continued weakness. Ultimately, we suggest you increase your exposure to inflation protected assets, and assets which benefit from a declining Dollar value.
What's In The Cards Now, For The Dow?
We are moderately bearish and still believe there is a soon to be 8-10% move lower, minimum. However, there has been no confirmation of a top in US stocks yet even though a small pull back was seen last week after touching another high for 2009. We know that there is strong resistance for the DOW at the current levels.
Fundamentally, economic news is expected to be mixed. Technically, the DOW is overbought,and experience moving average divergence; both of which are indicators of potential poor-negative performance. Also, the DOW is very near the 50% retracement level of it's Record high in late 2007 to it's low of earlier this year, 50% retracement from14198 to 6469 at 10334. 50% is a VERY significant number in technical analysis, specifically Fibonacci, because there is normally overwhelming tendency for markets to continue in a certain direction once it completes a 50% retracement. That certain direction the DOW has been in before this 50% retracement began, or March of 2009, is down. Hence, a downward move should very soon be seen to 9880, a short-term support level.

Wednesday, November 18, 2009
Analysis Reveals Some Great Opportunitues In the Oil Sector
One of the most reliable of inter-market relationships is that of the dollar and assets priced in dollars such as commodities. Normally this is an inverse relation, and rising asset prices result from a falling dollar, or vice-versa. The logic behind this reasoning is that if the dollar falls, it takes more of those dollars to purchase the same physical commodity. Consequently, the price for that commodity rises. While at times market relationships can decouple, eventually this inverse relationship holds true.
Although much of the recent focus on assets benefiting from a declining dollar have centered on precious metals, another asset that has been benefiting is oil. Oil, as measured by the United States Oil Fund (NYSE:USO) ETF, is quietly trading at prices unseen since last December. While this is still a long way from USO's 2008 summer highs in the low $100s, it is starting to get a boost, with long-term interest rates at historically low levels.
For many there is fear as to what will happen when the Fed eventually raises rates, and this possibility is probably starting to find its way into assets like this USO ETF. The chart for USO shows that it was able to clear a base it formed from May through October, and it has been consolidating from this breakout in a bullish fashion while forming a flag pattern. It will be interesting to see if it can follow through with a move above the $41-42 level.
One way to take advantage of rising oil is with a basket of oil service stocks. The Pro Shares Ultra Oil and Gas Index ETF (NYSE:DIG) measures the performance of the energy sector and components which include oil drilling equipment and services, coal, oil companies, pipelines, and gas producers and service companies. This ETF had been trading in a base for several months before finally clearing its resistance in October. It quickly retested its base support into early November, and appears to have held the area as support. The levels to watch in the near term are the recent highs near $39 and the recent low near $32.
One individual stock that may be worth an investment if the sector continues performing well is Precision Drilling Trust (NYSE:PDS). PDS had been forming a large cup-and-handle type base over the past several months and it finally made a push above resistance in September. It has been consolidating above the prior resistance area since the breakout and could be close to a breakout above this resistance. The $7.60 area deserves attention, as it has contained the past two rally attempts.
Another individual stock that could benefit from continued strength in the oil sector group is Core Labs NV (NYSE:CLB). CLB has been in a steady rising trend since bottoming in December 2008. It did experience a one-month correction after rallying to a high in early June, but it was able to break the June high a few months later in September. It is currently consolidating in a triangle base, a very good signal for you to consider investing in this stock because this is often a continuation pattern.
What All This Means For You
With oil at fresh several month highs, it is possible that momentum can carry the price farther than most think. If the dollar continues to weaken, which we believe it will, or the economy shows any signs of strengthening, which it already is, this could trigger a sharp rise in oil prices. While these ETF's and stocks are still in a longer term bear market, they have good prospects for a corrective move higher in the short to medium term, and even long term trend change around the corner. Rallies in down markets can often produce sharp gains quickly, so as an investor you should be open to all opportunities as long as they adhere to your risk tolerance, and time-frame.
Although much of the recent focus on assets benefiting from a declining dollar have centered on precious metals, another asset that has been benefiting is oil. Oil, as measured by the United States Oil Fund (NYSE:USO) ETF, is quietly trading at prices unseen since last December. While this is still a long way from USO's 2008 summer highs in the low $100s, it is starting to get a boost, with long-term interest rates at historically low levels.
For many there is fear as to what will happen when the Fed eventually raises rates, and this possibility is probably starting to find its way into assets like this USO ETF. The chart for USO shows that it was able to clear a base it formed from May through October, and it has been consolidating from this breakout in a bullish fashion while forming a flag pattern. It will be interesting to see if it can follow through with a move above the $41-42 level.
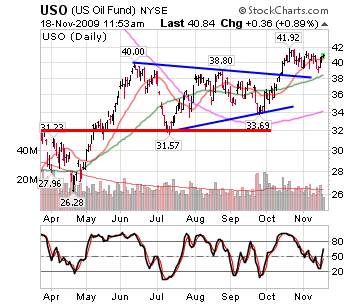 |
One way to take advantage of rising oil is with a basket of oil service stocks. The Pro Shares Ultra Oil and Gas Index ETF (NYSE:DIG) measures the performance of the energy sector and components which include oil drilling equipment and services, coal, oil companies, pipelines, and gas producers and service companies. This ETF had been trading in a base for several months before finally clearing its resistance in October. It quickly retested its base support into early November, and appears to have held the area as support. The levels to watch in the near term are the recent highs near $39 and the recent low near $32.
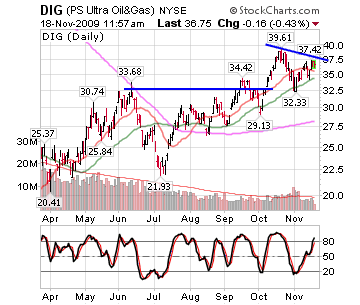 |
One individual stock that may be worth an investment if the sector continues performing well is Precision Drilling Trust (NYSE:PDS). PDS had been forming a large cup-and-handle type base over the past several months and it finally made a push above resistance in September. It has been consolidating above the prior resistance area since the breakout and could be close to a breakout above this resistance. The $7.60 area deserves attention, as it has contained the past two rally attempts.
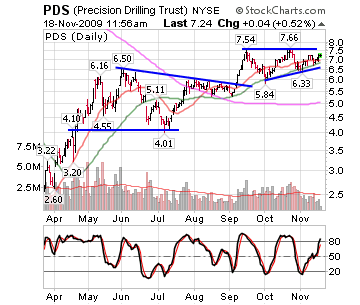 |
Another individual stock that could benefit from continued strength in the oil sector group is Core Labs NV (NYSE:CLB). CLB has been in a steady rising trend since bottoming in December 2008. It did experience a one-month correction after rallying to a high in early June, but it was able to break the June high a few months later in September. It is currently consolidating in a triangle base, a very good signal for you to consider investing in this stock because this is often a continuation pattern.
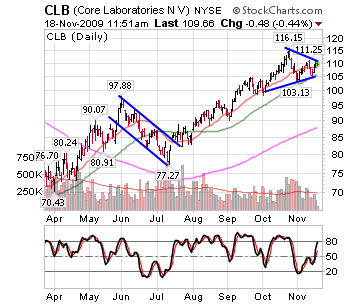 |
What All This Means For You
With oil at fresh several month highs, it is possible that momentum can carry the price farther than most think. If the dollar continues to weaken, which we believe it will, or the economy shows any signs of strengthening, which it already is, this could trigger a sharp rise in oil prices. While these ETF's and stocks are still in a longer term bear market, they have good prospects for a corrective move higher in the short to medium term, and even long term trend change around the corner. Rallies in down markets can often produce sharp gains quickly, so as an investor you should be open to all opportunities as long as they adhere to your risk tolerance, and time-frame.
Subscribe to:
Comments (Atom)


