A moving average is one of the most popular indicators used on chart analysis. Some investors and traders utilize moving averages because they do a great job of smoothing out irrelevant moves in price and presenting a visual representation of an assets trend. A moving average is the average price over a specified number of trading days. While there are many values and settings that traders can use, some of the most common values used are the 20 period (short-term trend), 50 period (medium-term trend), and 200 period (long-term trend) moving averages.
Investors should pay particular attention to a moving average's slope and its position relative to other moving averages. When a faster moving average crosses above (or below) a slower moving average, it reveals that an assets trend has been higher (or lower) in the near term than over the longer term average. While it may seem that a simple technique like this would offer limited value, trading or investing with the trend ONLY has been proven to produce spectacular investing/trading results (400%, 500%, 600% annual returns have been produced using moving averages only).
Below we have some analysis using the 20-period and 50-period moving averages. These Exchange Traded Funds below are at some defining periods in their trends, suggesting possible trend following buy points for you or time to take some profits if you have gotten in these specific ETF's at lower profits. Most of these ETF's have their 20-period moving average touching, or just above, their 50-period moving average, which suggests great buying points as financial instruments, such as stocks, often bounce and turn around in direction when these two moving averages touch or approach each other.
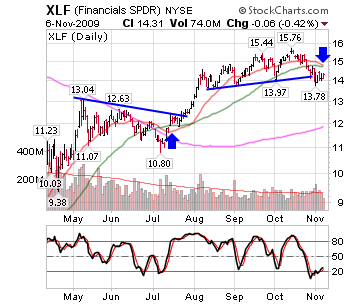
The Financial Select Sector SPDR (NYSE:XLF) ETF is an example of a sector ETF that has started to show some weakness and has its 20-day moving average crossing below the 50-day moving average. XLF broke under its 50-day moving average nearly one month ago, and has been consolidating underneath the average since, with very little progress. Often, a stock will resume the breakdown when the moving averages catch up to the trading price. One thing to keep in mind is that the crossover is not a magic signal to short a stock; in fact, the last crossover in XLF back in July signaled a decent buying opportunity. However, it does show objectively that a stock is experiencing weakness, and as such should be monitored.
 |
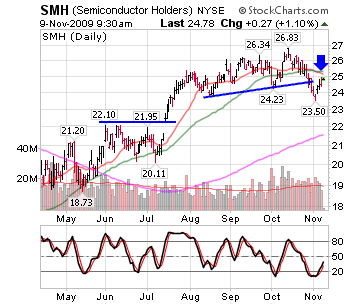
Semiconductors HOLDRs (NYSE:SMH) is another ETF that recently broke under its 50-day moving average and under a recent base. It is about to cross the 20- and 50-day moving averages as well, just as SMH bounces back into this resistance area. The semiconductors were leading the markets for much of the summer. They have now set a lower low, and are in danger of failing on this bounce higher. One key level to watch is to see if SMH can close back above its 50-day moving average and begin to consolidate above this level. This would eventually negate the negative crossover, and possibly set up a bear trap.
 |
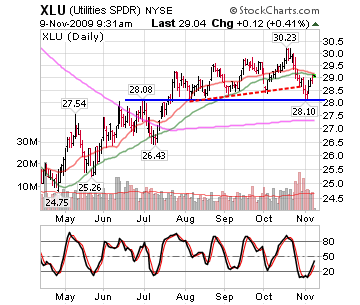
Utilities Select Sector SPDR (NYSE:XLU) is another ETF that has the 20-day moving average crossing below the 50. It is also in the process of bouncing back into this moving average cluster after testing a major support level near $28. The key level to watch here is how XLU deals with the moving averages as resistance, as a move back above the cluster could be a sign of strength. However, if XLU rolls over in this area, it could be a prelude to a much larger breakdown.
 |
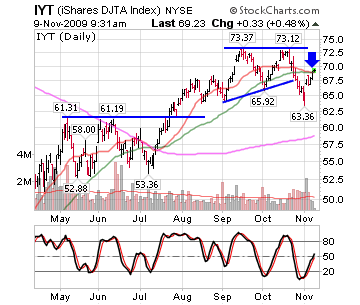
The iShares Dow Jones Transportation Average (NYSE:IYT) is another example of an ETF bouncing back into resistance formed by the 20-day moving average crossing below the 50-day moving average. IYT also set a lower low in the recent pullback in early November, which hints at weakness. IYT is currently at a critical juncture, and needs to hold up in this area in order to avoid a failure and possibly setting a lower high.
 |
What Does This Technical Analysis Mean For You?
While a moving average crossover is not a definite signal to enter a trade, it provides an objective view into the trending nature of a particular asset. It is worth paying attention to the direction, slope and order of the moving averages, as it not only measures the average price of a stock, but the behavior of traders. When a cluster of moving averages is headed lower, it often signals that traders are selling into rallies, and thus the moving averages can act as resistance. With several sector ETFs in this situation, it bears watching to see how they react at these critical levels. The result could not only offer a good trading opportunity, but also a clue into the next move for the markets.


No comments:
Post a Comment
We would love for you to express your opinion, or ask us a question on our blog!